In today’s fast-paced business environment, staying ahead of the competition requires clear insights from vast amounts of data. Data visualization plays a crucial role in competitive market analysis by turning raw data into actionable insights. This article explores how businesses can leverage data visualization techniques effectively.
Why Data Visualization is Essential for Competitive Market Analysis
Data visualization helps businesses:
- Identify trends and patterns quickly.
- Compare market performance over time.
- Make informed strategic decisions.
- Improve communication of insights across teams.
By partnering with a data visualization company, businesses can access expert tools and techniques to gain a competitive edge.
Key Data Visualization Techniques for Market Analysis
1. Heat Maps for Consumer Behavior Analysis
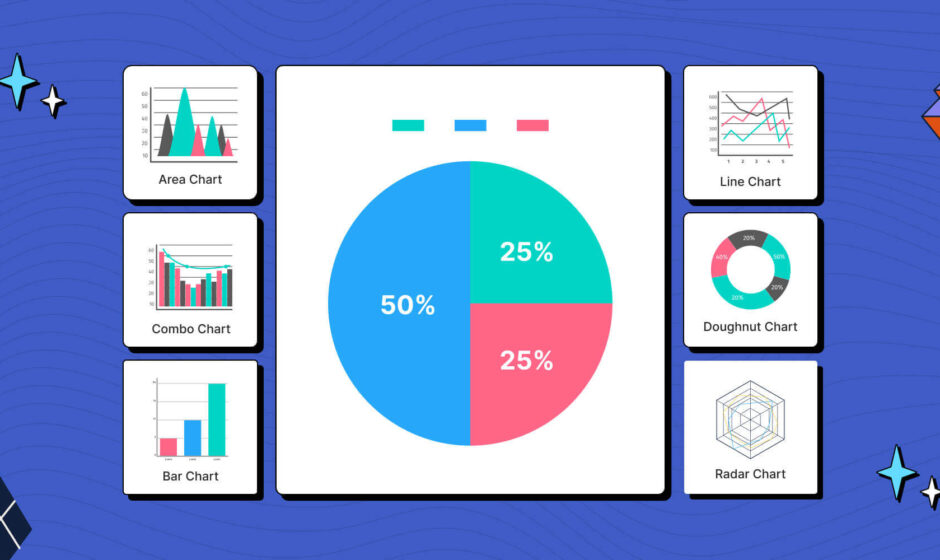
Heat maps help businesses visualize customer engagement, sales trends, and website interactions. These visual tools highlight areas of high activity, allowing companies to refine marketing strategies and improve user experience.
2. Line and Bar Graphs for Sales Performance Tracking
Tracking sales performance over time helps businesses identify growth trends and seasonal fluctuations. Line and bar graphs provide a clear representation of revenue patterns, helping decision-makers adjust strategies accordingly.
3. Competitive Benchmarking with Radar Charts
Radar charts allow businesses to compare multiple competitors across various metrics, such as market share, customer satisfaction, and pricing strategies. This visualization technique ensures a holistic view of the competitive landscape.
4. Geographic Maps for Market Expansion
Businesses looking to expand into new regions can use geographic maps to analyze market potential, customer demographics, and regional sales performance. A data visualization company can help create interactive maps to simplify complex market data.
Steps to Implement Data Visualization for Market Analysis
Step 1: Collect and Organize Data
Gather data from multiple sources, including customer analytics, competitor reports, and industry trends. Clean and structure the data to ensure accuracy before visualization.
Step 2: Choose the Right Visualization Tools
Selecting the appropriate visualization tools is crucial. Options include:
- Google Data Studio
- Tableau
- Microsoft Power BI
- Python and R for custom visualizations
For businesses without in-house expertise, an offshore dedicated team can assist with data visualization setup and implementation.
Step 3: Build Custom Dashboards
Custom dashboards provide real-time insights into market dynamics. They allow businesses to track KPIs, competitor performance, and emerging trends in a single view.
Step 4: Analyze Insights and Take Action
Regularly review visualization reports to make data-driven decisions. By leveraging insights, companies can:
- Optimize marketing campaigns.
- Adjust pricing strategies.
- Identify new market opportunities.
Conclusion
Data visualization is a powerful tool for competitive market analysis. By working with a data visualization company, businesses can turn complex data into clear, actionable insights. Additionally, an offshore dedicated team can support businesses in setting up and managing data visualization projects efficiently. Investing in the right visualization strategies ensures that companies remain agile and competitive in their industry.


